NEW documentation: This article covers setup for OWOX BI. For the latest guides on setting up FREE connectors and Data Marts, visit the new OWOX Data Marts documentation.
Build reports based on any online and offline events data stored in Google BigQuery
Now you can connect Custom events to your Smart Data source set and use them to build reports.
Custom events are data about any online and offline events you have uploaded to a Google BigQuery table by yourself. It can be CRM and call-tracking data, data on emails sent and more.
A BigQuery table containing custom events must have this data schema. It’s the same structure you need to build an OWOX BI Attribution model based on custom events.
To use custom events data for your Smart Data reports, connect a table with custom reports data to your Smart Data source set: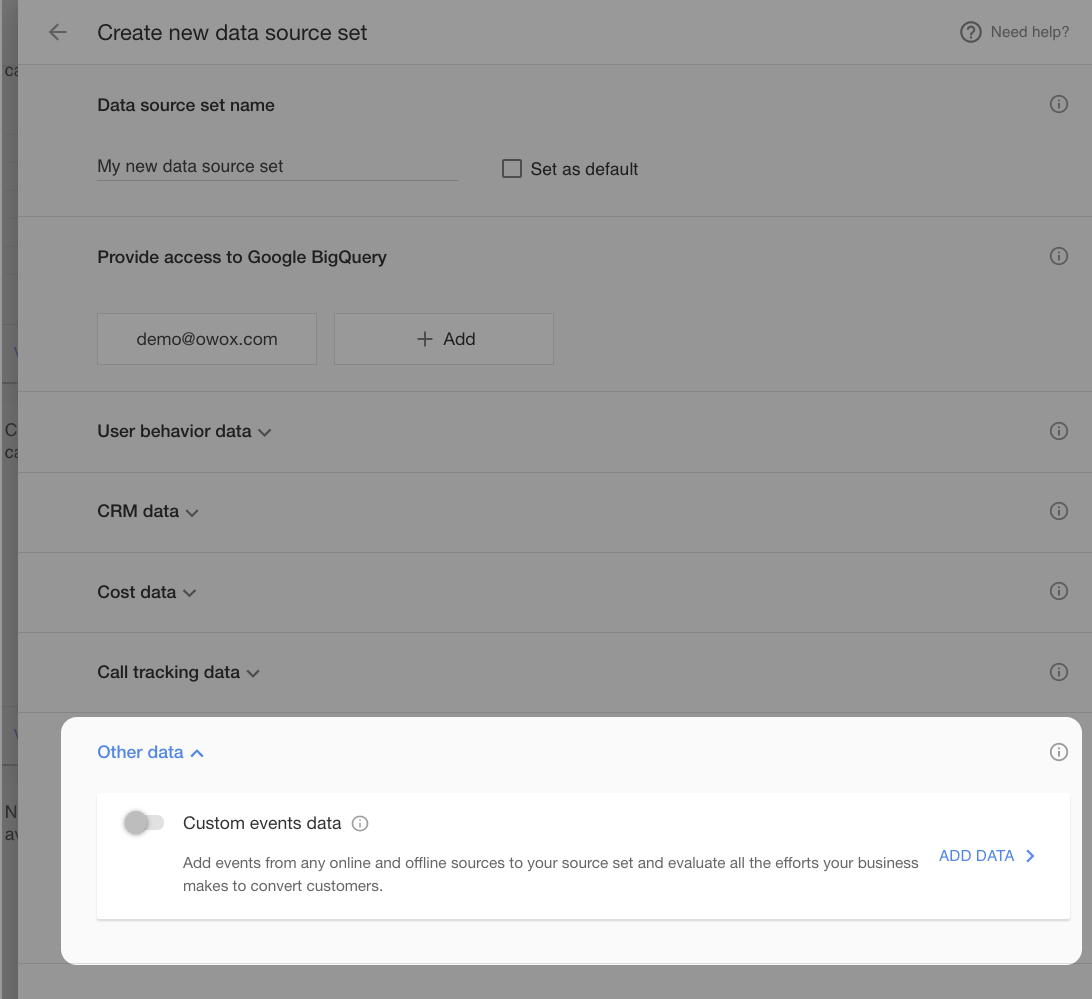
Important:To build a report that includes both custom events data and data from any other data source, make sure that metrics and dimensions you've selected for your report have the same data sources.
You can check the data sources for each metric and dimension by clicking the ? next to the metric/dimension name: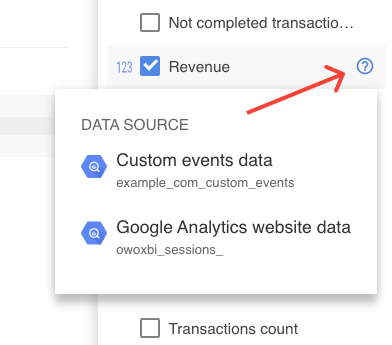 For example, if you want to build a report based on both custom events data and website user behavior data, then all the metrics and dimensions selected for the report must have as data sources both an "owoxbi_sessions_" table and a custom events data table.
Break down report table row data by additional dimensions
Now you can quickly break down and filter out separate report rows by additional dimensions.
Select a row you want to explore further, click the breakdown button and select the dimension by which you want to break down the row data.
For example, in the "Revenue by traffic sources" report, you can first make a breakdown by medium: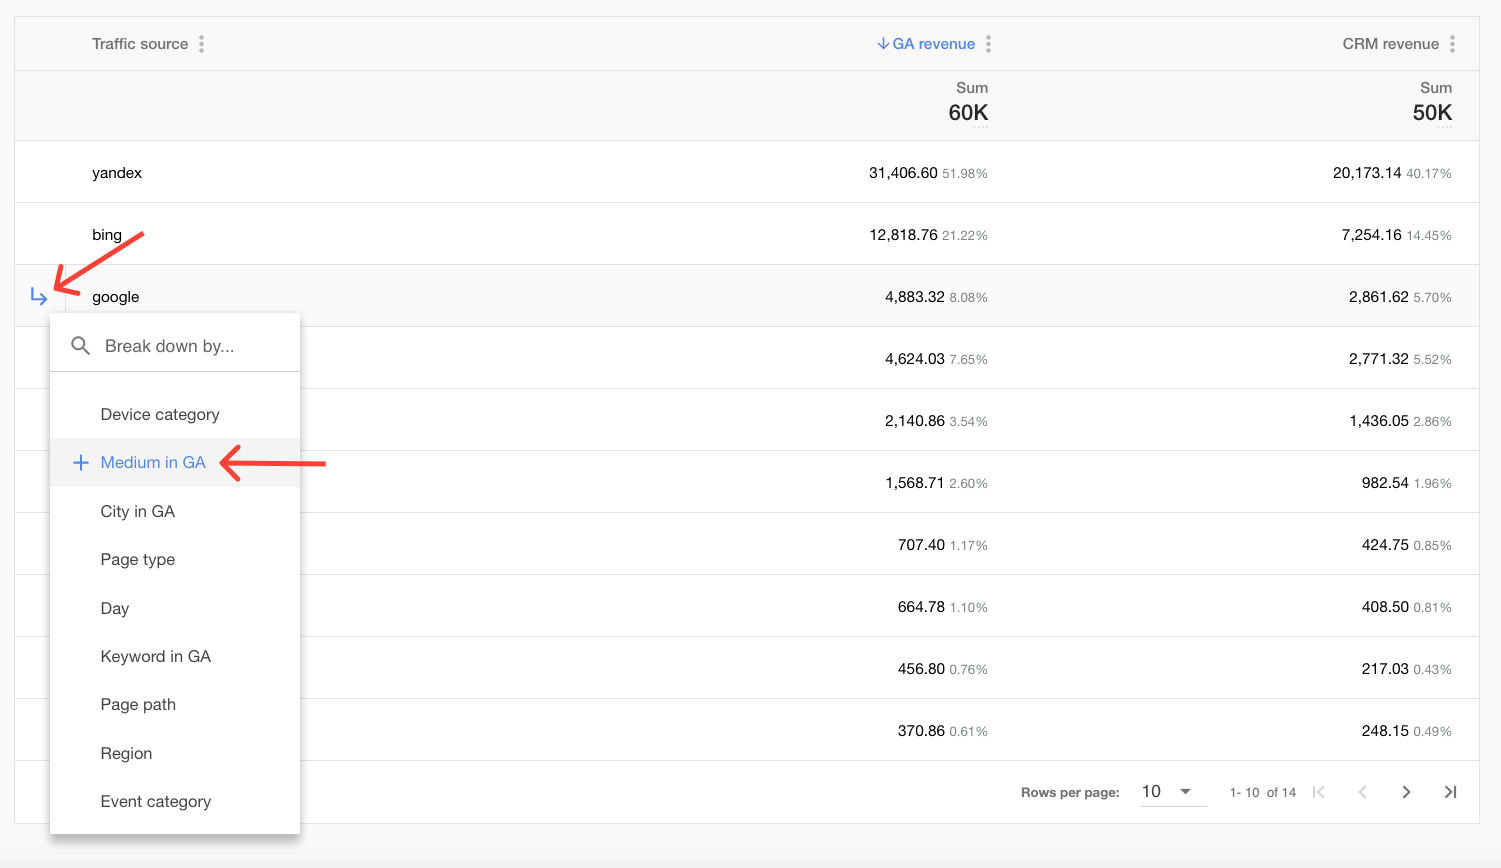
The Medium dimension will be added to the table, and the table itself will be filtered by the selected row's Traffic source values: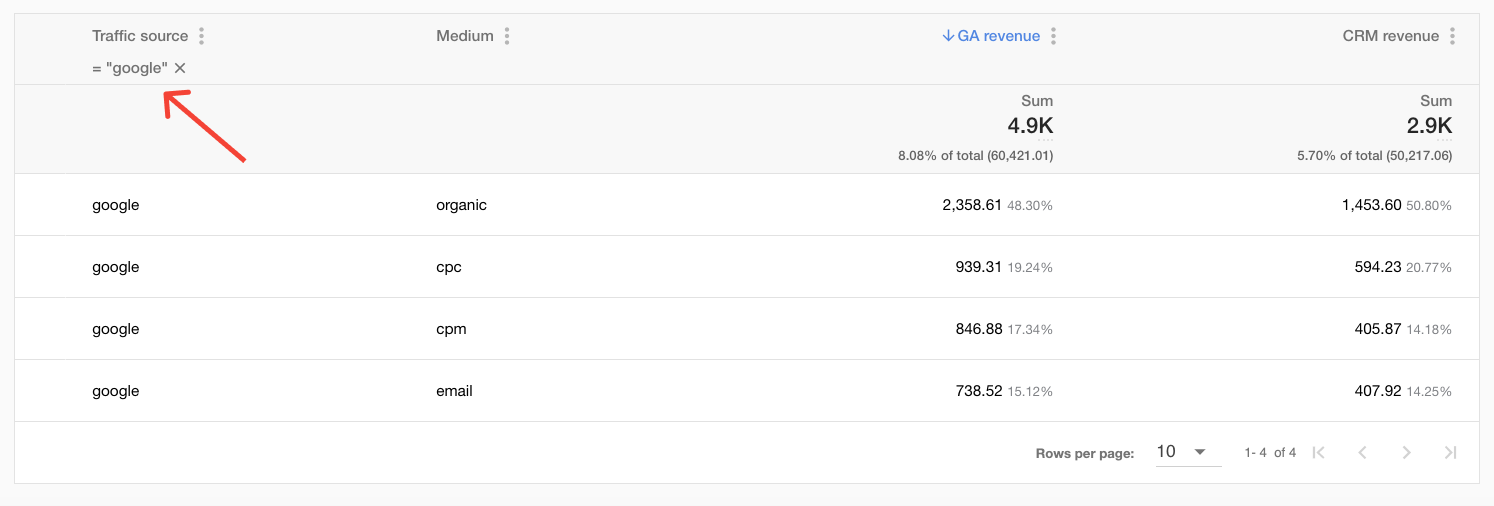
Then, you can break down the data even further by selecting the row with the medium you want to explore (say, cpc) and adding a Campaign dimension: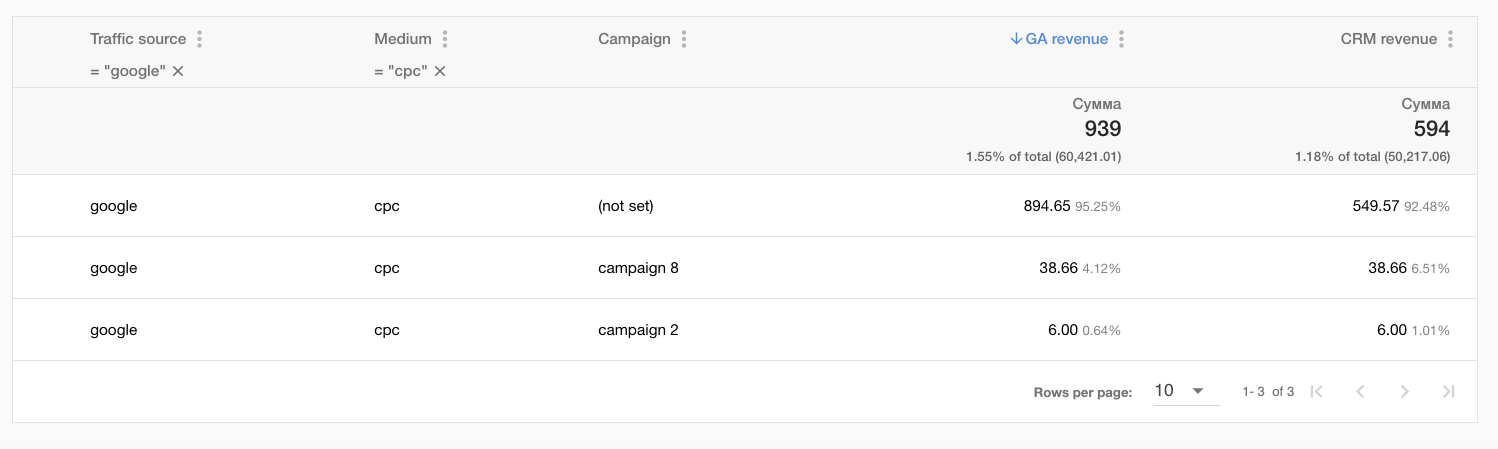
The breakdown works for all the reports in Smart Data except the template attribution data reports.
Reports history
Now you can quickly find the reports you've recently built or viewed.
To access these reports, go to the Reports history tab on the Smart Data main page.
Here, you can access 20 most recent reports, open, edit, or save them as favorites:
The history is being stored on a user level for each OWOX BI project.
Selected metrics and dimensions menu
Now you can quickly view in a separate menu all the metrics and dimensions selected for the report: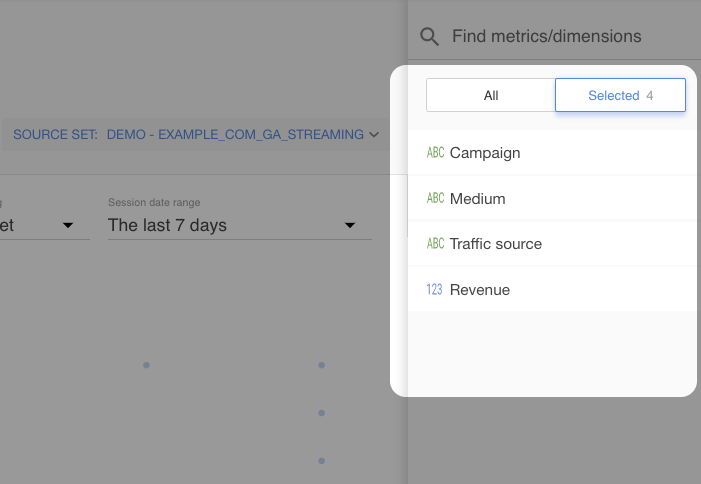
In this menu, you can quickly view what metrics and dimensions are used for the current report, view their data sources, and remove the definitions you don't want to see in the current report.
0 Comments